Reliability Engineering
How Fast Should a Network Fix Roll Out? Almgren-Chriss for Operations
Optimal-execution pacing from trading, adapted to network rollouts. Adding a hard churn limit cut expected damage 43% vs plain Almgren-Chriss; canaries still win the worst case when the fix might be bad.
Raghav Balasubramaniam
Result in one line. Plain Almgren-Chriss beats "big bang" and naive schedules. It misses one thing networks have: a hard limit on how many changes the control plane can absorb at once. Adding that limit cut expected damage from 549 to 312 device-minutes (−43%). When the fix itself might be bad, the classic canary rollout still has the best worst case, and joining the two approaches is an open problem.
Once a NOC knows what is broken, it still has to decide how to apply the fix: a config change, a firmware upgrade, a traffic drain across dozens of devices. Go too fast and the changes themselves destabilise the network, with routing reconvergence storms and control-plane churn. Go too slow and devices stay broken longer.
Banks face the same trade-off when selling a large block of shares, and the standard answer there is the Almgren-Chriss model (2000). This note adapts it to network remediation, tests it in simulation, and shows where it needs to change for networks.
The model
Almgren and Chriss asked: to sell X shares within time T, how many should be sold in each interval? Selling fast moves the price against you (market impact). Selling slowly leaves you exposed to random price moves (risk). They minimise expected cost + λ × variance of cost, where λ is how much you dislike uncertainty. With λ = 0 you only care about the average. With large λ you pay more on average to avoid a bad worst case. The optimal plan has a closed form: the number still to trade decays like sinh(κ(T − t)) / sinh(κT), where κ grows with λ.
Mapping trading to network operations
Trading | Network rollout |
|---|---|
Shares left to sell | Devices still to fix |
Market impact from selling fast (grows with the square of speed) | Reconvergence churn from changing many devices at once |
Price volatility while holding shares | Random, shared damage on every unfixed device while the incident continues |
Price drift | Expected damage per unfixed device per minute |
Risk aversion λ | How much the NOC fears a bad day versus a bad average |
With drift included there is no longer a closed form, but the problem is still quadratic and reduces to a small tridiagonal linear system that solves in microseconds. We check our solver against the paper's closed-form answer (drift = 0) and it matches exactly.
The experiment
A fix must reach 48 devices within 30 one-minute steps. Cost is counted in device-minutes of degraded service over a 60-minute window. Each schedule is run 20,000 times.
Exposure: each unfixed device costs 1 device-minute per minute on average, plus a shared random shock (σ = 1).
Churn: changing n devices in one minute costs 0.5·n², the model's own assumption.
What Almgren-Chriss does not know about (the network reality): devices are whole numbers; more than 8 changes in one minute triggers a reconvergence storm costing 20 device-minutes per change over the limit; and the fix itself may be bad (probability 0, 5% or 20%). Each fixed device reveals a bad fix with 10% chance per minute. On detection the rollout stops and is rolled back, which takes 5 minutes, and each bad-fixed device costs 3× the normal damage until then.
Schedules compared
Devices changed per minute, first minutes of each plan:
Schedule | Plan |
|---|---|
Big bang | 48 in minute 1 |
Uniform | 1–2 per minute for 30 minutes |
AC, λ = 0 (average only) | 16, 15, 14, 3 |
AC, λ = 0.05 | 16, 11, 8, 7, 4, 2 |
AC, λ = 1.0 (very risk-averse) | 36, 9, 3 |
Canary 1-10-30-100% | 1, wait, 4, wait, 10, wait, 11, 11, 11 |
Canary then AC | 1, wait 5 min, then AC on the other 47 |
AC λ = 0.05, capped at 8/min | 8, 8, 8, 8, 8, 8 |
Plotted against the control plane's churn limit, the difference between the plans is easy to see: every uncapped Almgren-Chriss plan crosses the limit in its first minutes.
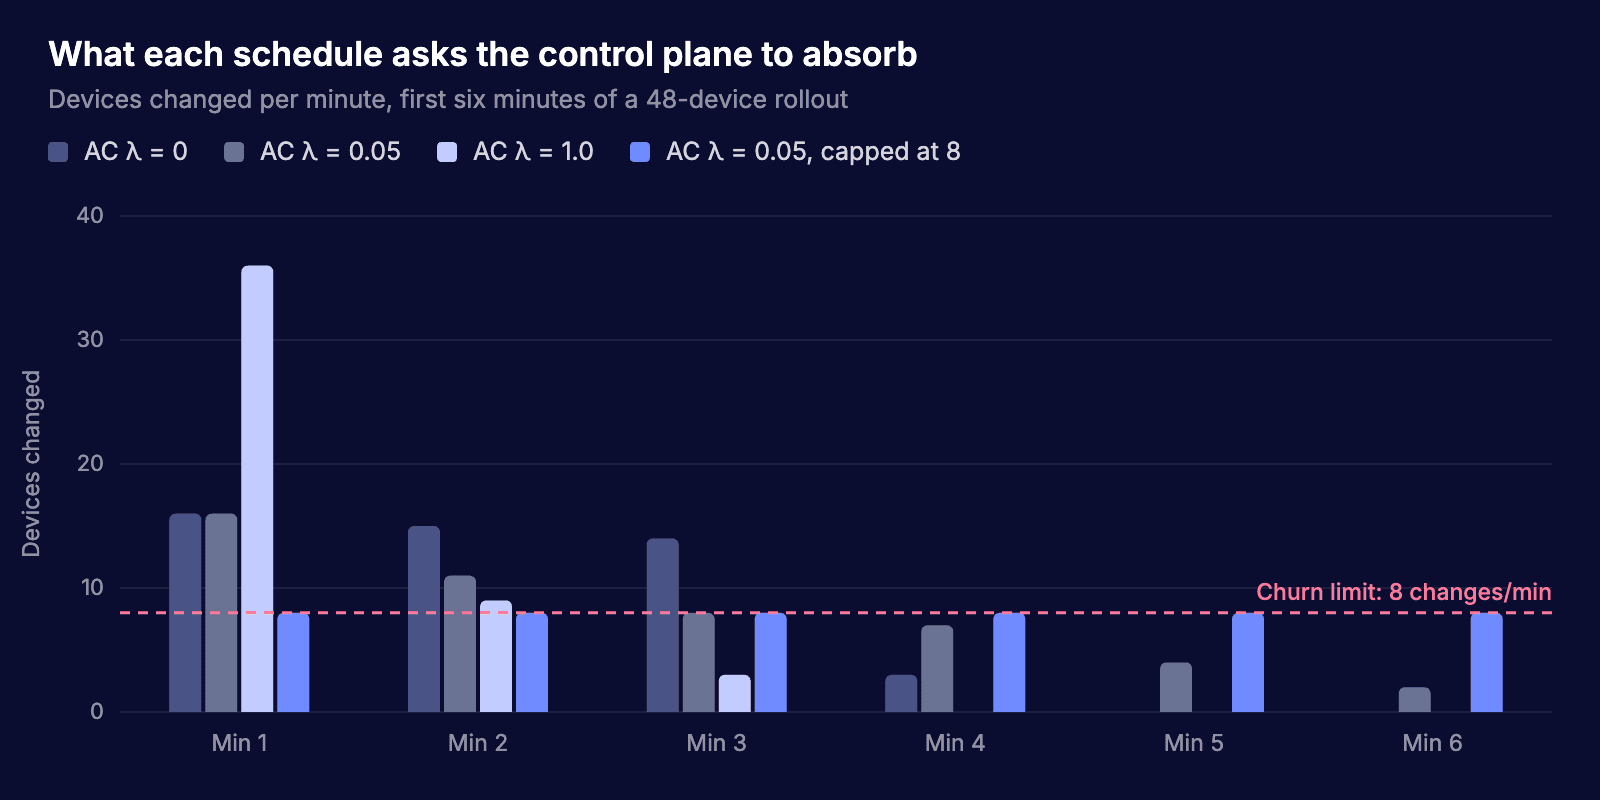
Figure 1. Devices changed per minute in the first six minutes. Every uncapped Almgren-Chriss plan crosses the churn limit.Results
When the fix is good
Capping Almgren-Chriss at the churn limit gave both the lowest average and the lowest spread of any schedule.
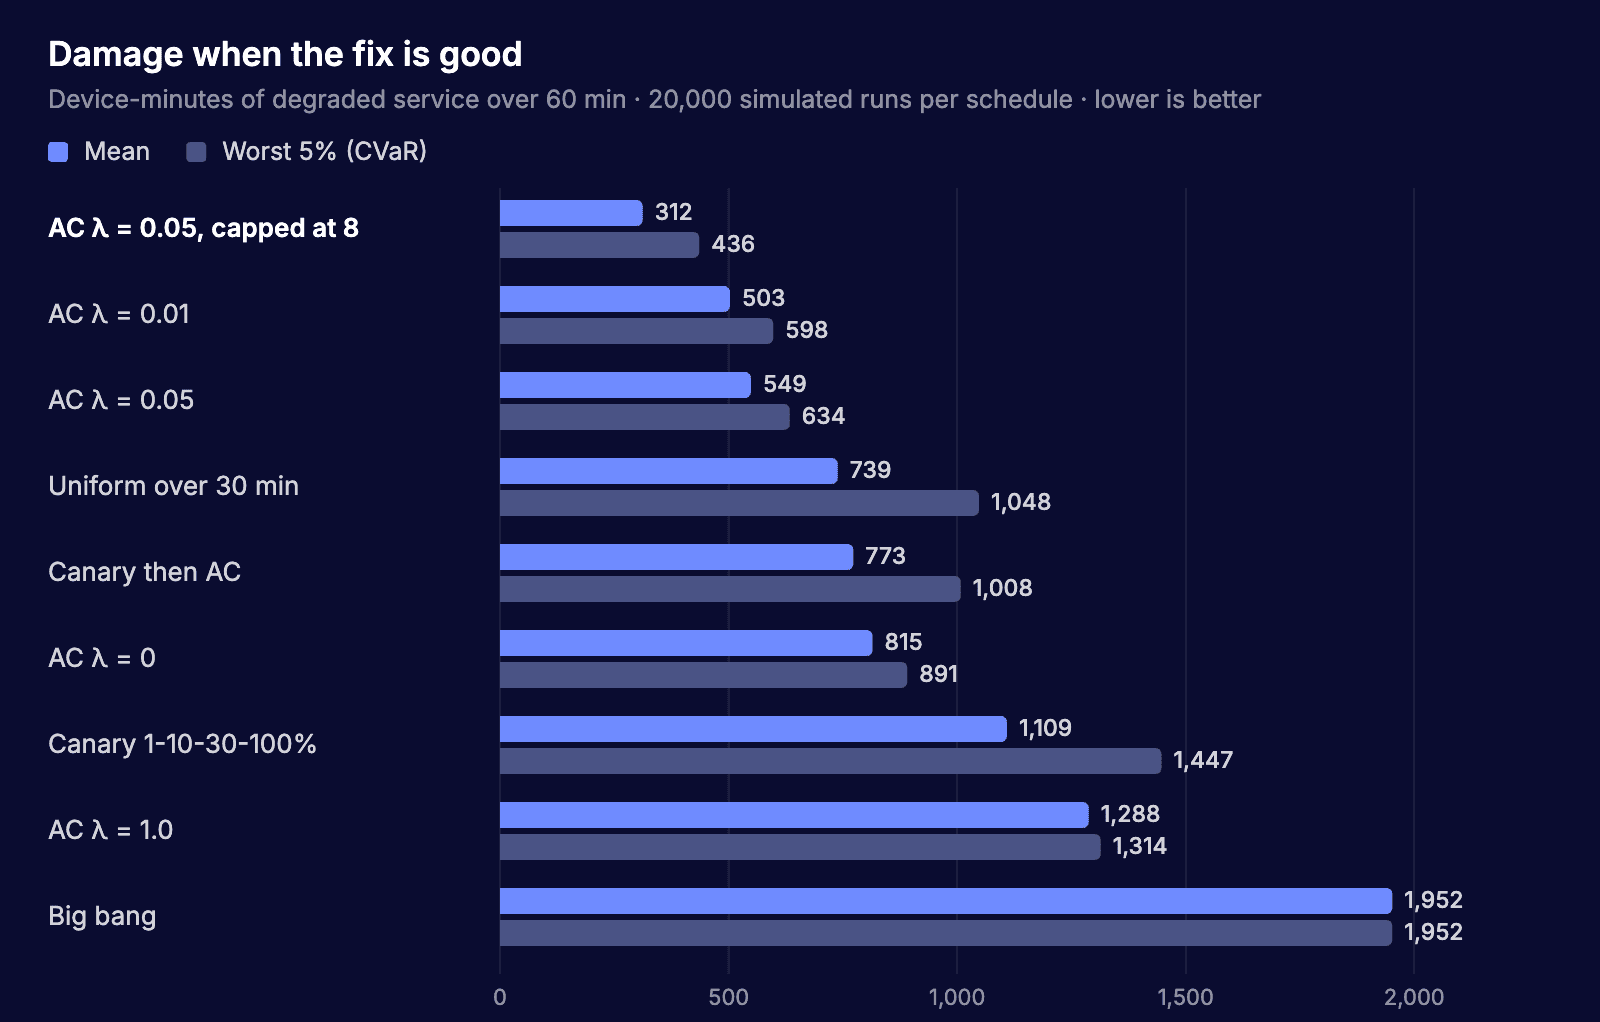
Figure 2. Mean and worst-5% damage when the fix is good. Capping AC at the churn limit wins on both.
Schedule | Mean cost | Std dev | Worst 5% (CVaR) | Peak changes/min | Done by minute |
|---|---|---|---|---|---|
Big bang | 1,952 | 0 | 1,952 | 48 | 1 |
Uniform over 30 min | 739 | 149 | 1,048 | 2 | 30 |
AC λ = 0 | 815 | 37 | 891 | 16 | 4 |
AC λ = 0.01 | 503 | 46 | 598 | 13 | 5 |
AC λ = 0.05 | 549 | 41 | 634 | 16 | 6 |
AC λ = 1.0 | 1,288 | 12 | 1,314 | 36 | 3 |
Canary 1-10-30-100% | 1,109 | 163 | 1,447 | 11 | 18 |
Canary then AC | 773 | 114 | 1,008 | 15 | 11 |
AC λ = 0.05, capped at 8 | 312 | 60 | 436 | 8 | 6 |
All costs in device-minutes of degraded service.
When the fix might be bad
Once the fix itself can fail, slow early rollouts earn their keep: they find a bad fix cheaply.
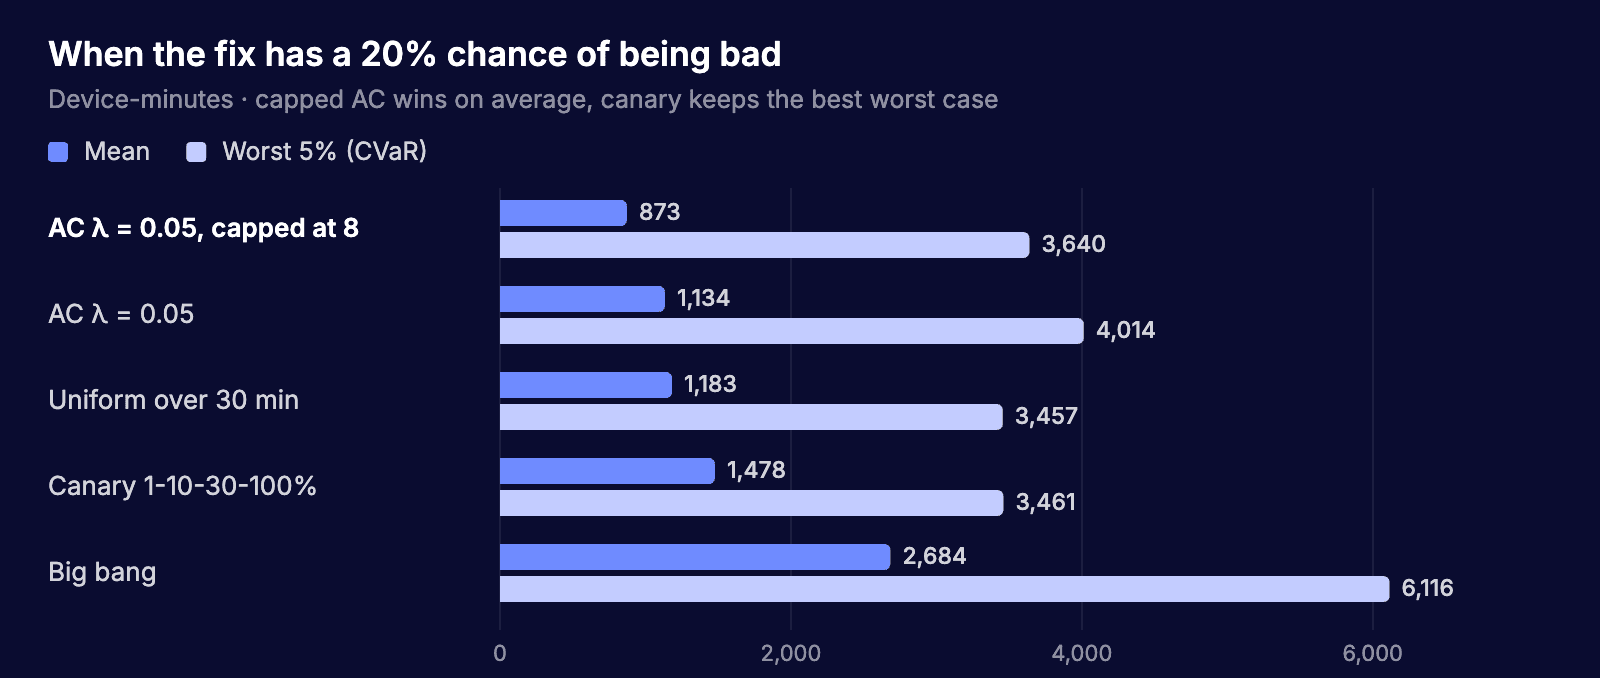
Figure 3. With a 20% chance of a bad fix, capped AC has the lowest mean, but the canary keeps the best worst case.
Schedule | Mean (5% bad) | Worst 5% (5% bad) | Mean (20% bad) | Worst 5% (20% bad) |
|---|---|---|---|---|
Big bang | 2,136 | 5,629 | 2,684 | 6,116 |
Uniform over 30 min | 851 | 2,974 | 1,183 | 3,457 |
AC λ = 0.05 | 696 | 3,496 | 1,134 | 4,014 |
Canary 1-10-30-100% | 1,202 | 2,970 | 1,478 | 3,461 |
AC λ = 0.05, capped at 8 | 453 | 3,134 | 873 | 3,640 |
What it means
Big bang is the worst choice in every setting. Changing all 48 devices at once costs 1,952 device-minutes from churn alone, with no upside.
The hard churn limit is the key network fact. Almgren-Chriss treats impact as a smooth curve, so it sometimes plans 16 changes in one minute. Real control planes have a threshold, and above it the cost jumps. That is why AC with λ = 0.01 beat λ = 0 on the average, which AC's own maths says cannot happen: the λ = 0 plan crosses the threshold harder. Taking AC's plan and capping it at the limit (spilling the excess into the next minute) gave the lowest average cost and the lowest spread of any schedule: 312 device-minutes, 43% less than plain AC.
Risk aversion works the other way from trading intuition. In trading, a risk-averse seller trades faster to get rid of exposure. Here too, high λ front-loads (36 devices in minute 1). That pushes into the churn limit and costs more. For networks, moderate λ with a cap is the right combination.
Almgren-Chriss cannot learn during the rollout. When the fix might be bad, going slowly at first is valuable because it lets you find out cheaply. AC has no concept of this. At a 20% chance of a bad fix the classic canary had the best worst case (3,461 vs 3,640), even though its average was much higher. Uniform pacing was similar, for the same reason.
The open research question
The right schedule should combine AC's pacing with learning: go slowly while unsure the fix works, then speed up to the churn limit once enough devices have succeeded. That is an optimal stopping problem joined to an optimal execution problem. We have not solved it here. It is the most interesting follow-up from this note, because neither the trading literature nor standard canary practice covers it.
Limits
All costs are made up but consistent. The numbers (1 device-minute exposure, 0.5·n² churn, limit of 8) were chosen to be plausible, not measured. The ranking of schedules depends on their ratios. Real values would come from a customer's change history and control-plane metrics.
One shared shock. We assume the incident's damage hits all unfixed devices together, as in the original model. Independent damage per device would lower the variance of every schedule.
Every device counts the same. In reality some devices carry more traffic and should go first.
Next steps
Build the "learn then accelerate" schedule and test it against canary and capped AC.
Weight devices by traffic or customer impact.
Estimate the churn limit and cost curve from real reconvergence data.
References
R. Almgren and N. Chriss, Optimal execution of portfolio transactions, Journal of Risk, 2000.